
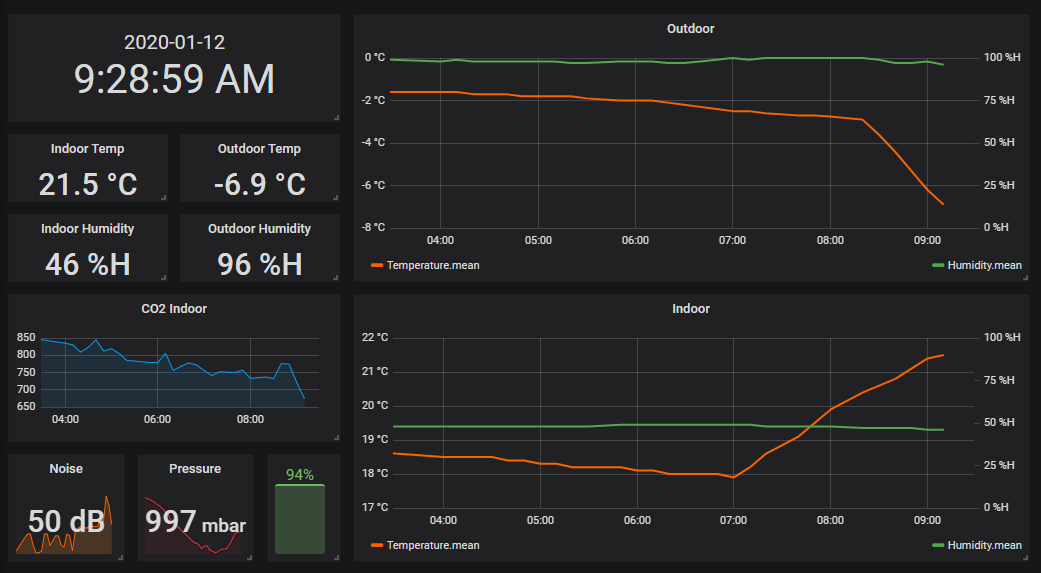
Netatmo Dashboard
Netatmo Database and Graph Visualization
This is a tutorial for setting up a Raspberry Pi to fetch and store Netatmo weather station data in a InfluxDB database. Information is also included for displaying the database information with Grafana on a kiosk style screen.
Using:
- Raspberry Pi
- Netatmo API
- InfluxDB
- Grafana
1. Install Rasbian and Configure Pi
There are thousands of tutorials out there on how to do this. Google it and find one with the level of detail your experience requires. Here are the basic steps (mostly so I can remember):
- Use balenaEtcher to prepare SD card with latest full version of Rasbian
- Plug in networking, monitor, keyboard and power
- Log in with user: pi password: raspberry
- Change password
- Expand file system
- Turn on SSH
sudo rebootsudo apt updatesudo apt upgrade
2. Sign up for Netatmo App
You will need a ID and Key from Netatmo in order to use their API.
- Go to https://dev.netatmo.com/apps/createanapp and follow the steps to sign up
- Find your client ID and your client secret
- Look through the API documentation.
3. Install InfluxDB
- Follow most of this this tutorial
- In the Using InfluxDB on your Raspberry Pi section only do steps 1 and 2
- Create a database using step 2 and name it whatever you want, just remember this name
- Go to the Adding Authentication to InfluxDB section and do all steps
- Now you should have an influx database up and running that will start on reboot
4. Use a script to pull data from Netatmo and write it to the database
- See fetchAndWriteData.py. This file was was adapted from github user arnesund
- I think netatmo stores data every 10min so set code to run every 8
- Use cron
- Example:
*/8 \* \* \* \* /home/pi/fetchAndWriteData.py >> /home/pi/netatmoLogs.txt
The » means that the script output will be appended to the .txt file that follows
5. Install Grafana
- Follow this tutorial by pimylifeup
- When you get to step 2 of the Installing Grafana to the Raspberry Pi section, go to the Grafana downloads page and use the latest version for the raspberry pi you are using.
- For example when installing on an ARMv7 raspberry pi use the following:
sudo apt-get install -y adduser libfontconfig1
wget https://dl.grafana.com/oss/release/grafana_<latest_release>_armhf.deb
sudo dpkg -i grafana_<latest_release>_armhf.deb
- For example when installing on an ARMv7 raspberry pi use the following:
- Connect InfluxDB using default settings and your username and password from when you installed influx
6. Configure Grafana Dashboard
- Play around with the queries and visualizations until you get something you are happy with
-
If you download a plugin you will need to restart the server with:
systemctl restart grafana-server
-
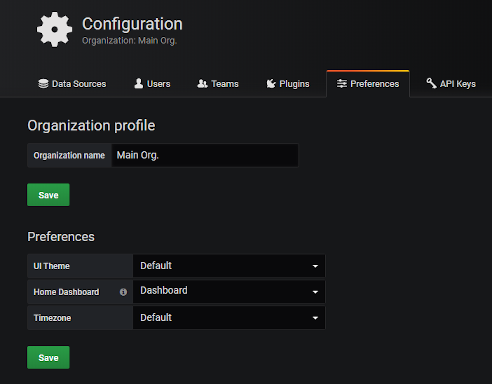
Set the dashboard you just created as the home dashboard in Configuration->Preferences->Home Dashboard
7. Set Grafana to start in kiosk mode at startup
- Use the instructions from here
- Use wget to grab the tar file from releases section
- Find URL of latest release gz
wget URL- Extract the tar file with
tar xvzf <path/to/tar.gz>
- Pick a way to do automatic startup
- I used the Systemd startup option
- Use the first two commands to create the file and edit permissions:
$ sudo touch /etc/systemd/system/grafana-kiosk.service $ sudo chmod 664 /etc/systemd/system/grafana-kiosk.service - Use the following to open the file in a text editor:
$ sudo nano grafana-kiosk.serviceand then paste:
```BASH [Unit] Description=Grafana Kiosk Documentation=https://github.com/grafana/grafana-kiosk Documentation=https://grafana.com/blog/2019/05/02/grafana-tutorial-how-to-create-kiosks-to-display-dashboards-on-a-tv After=network.target
[Service] User=pi Environment=”DISPLAY=:0” Environment=”XAUTHORITY=/home/pi/.Xauthority” ExecStart=/usr/bin/grafana-kiosk –URL
-login-method local -username -password --kiosk-mode full --lxde [Install] WantedBy=graphical.targe ```
- Make sure to personalize the
ExecStart=section based on what you want to see and which options you want to use - Follow the rest of the instructions in that section
That should be everything
References:
Netatmo API docs
Pimylifeup tutorial on Influxdb
Pimylifeup tutorial on Grafana
arnesund’s original python file
Grafana docs for plugins
How to set up Grafana as a kiosk